COVID-19 pandemics has challenged emergency response systems worldwide, with widespread reports of essential services breakdown and collapse of health care structure. Testing capacity is also problematic in several countries, where diagnosis demand outnumbers available local testing capacity.
Decision-Making During the COVID-19 Pandemic
Background
Methods
A Naïve-Bayes model for machine learning is proposed for handling different scarcity scenarios. Hemogram result data was used to predict qRT-PCR results in situations where the latter was not performed, or results are not yet available. Adjusts in assumed prior probabilities allow fine-tuning of the model, according to actual prediction context. The results can be used for screening of patients to be tested in a scenario where few qRT-PCR or IgM/IgG tests are available.
Additional Information
Instructions
- All variables must be filled in.
- The units must be respected.
- Prior choice: select the prior probability of Covid-19 infection. Adjust for each patient according to symptoms and contamination risk. We suggest the use of 0.5 (when no information is available, meaning there is an equal probability of positive or negative result before using hemogram data) or disease prevalence in local population, when available. Keep in mind that a 0.5 prior is very conservative and while it correctly identifies most positive cases, it also leads to a higher number of false positive results.
- This tool is based on blood alterations causes by Covid-19 in symptomatic patients. It is possible that other inflammatory or Infectious processes also cause similar alterations.
- The results should only be used for screening patients who will perform qRT-PCR or IgM/IgG antibody detection tests.
- The results of this tool do not replace any tests such as RT-PCR or IgG/IgM antibody detection.
Contact Us
Dr. Márcio Dorn
- UFRGS
Dr. Clarice Sampaio Alho
- PUCRS
Dr. Eduardo Avila
- INCT/PF
Dr. Alessandro Kahmann
- FURG
Complete Blood Count (CBC)
10
+
10
=
Invalid equation result provided. Please, try again.
Request successfully submitted. Please, wait the results.
Positive %
0.0
Negative %
100.0
Basophils
40.0
Eosinophils
150.0
Hematocrit
36.0
Hemoglobin
102.0
Leukocytes
6580.0
Lymphocytes
6580.0
MCH
59.6
MCHC
33.3
MCV
88.4
Monocytes
430.0
MPV
11.4
MPV
11.4
MPV
259000.0
MPV
0.5
RBC
4.05
RBC
13.1
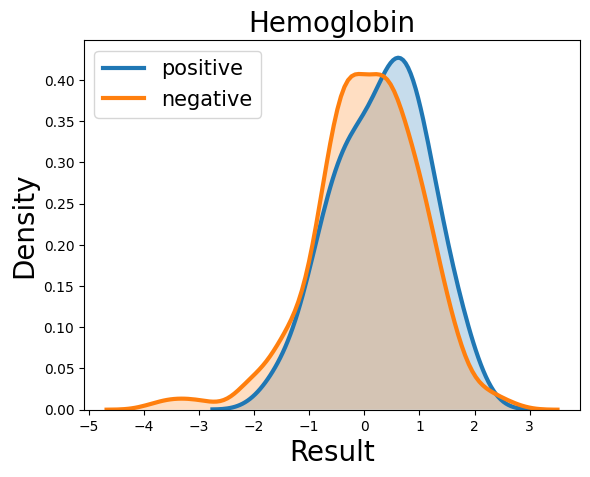
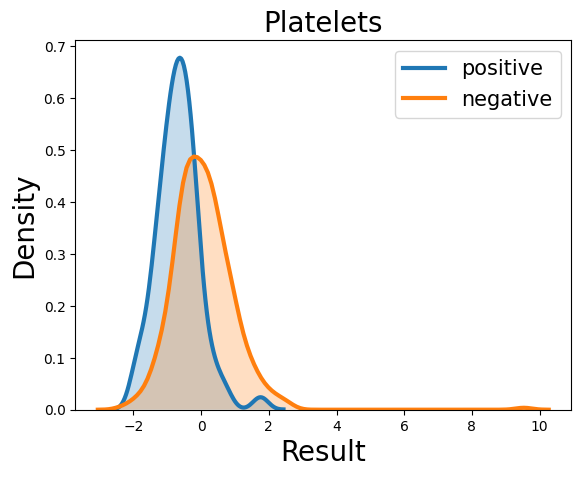
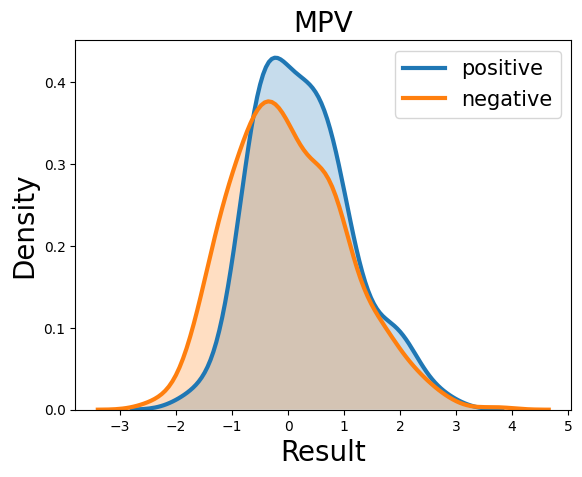
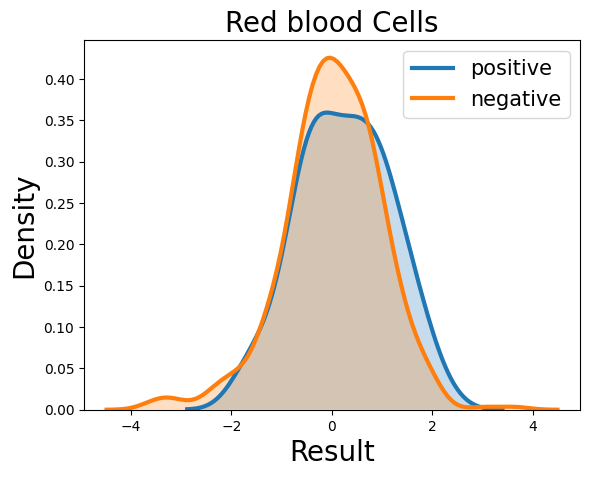
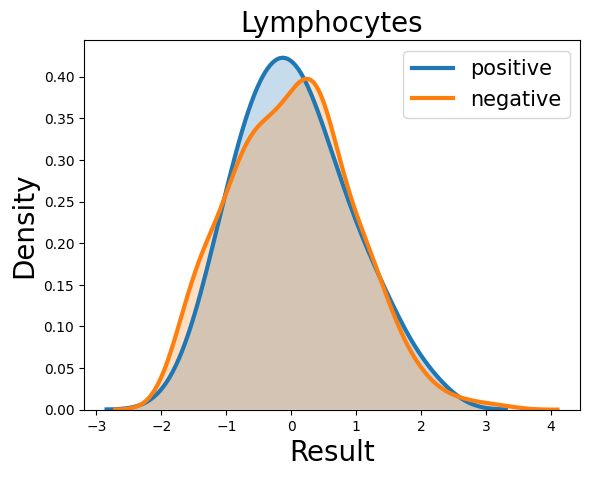
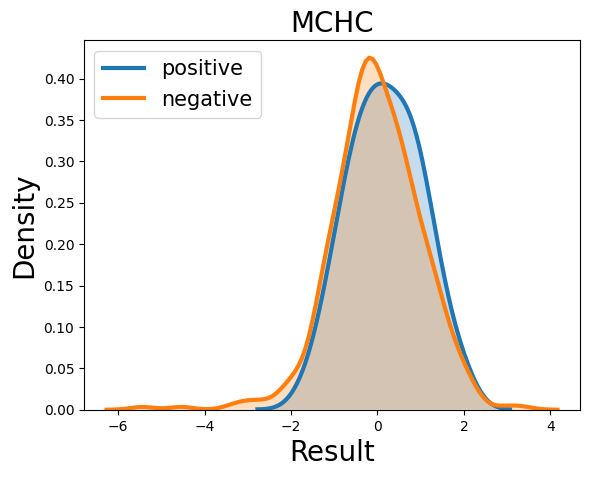
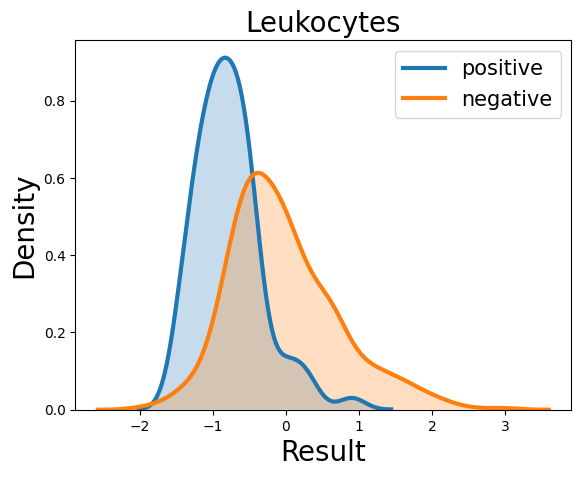
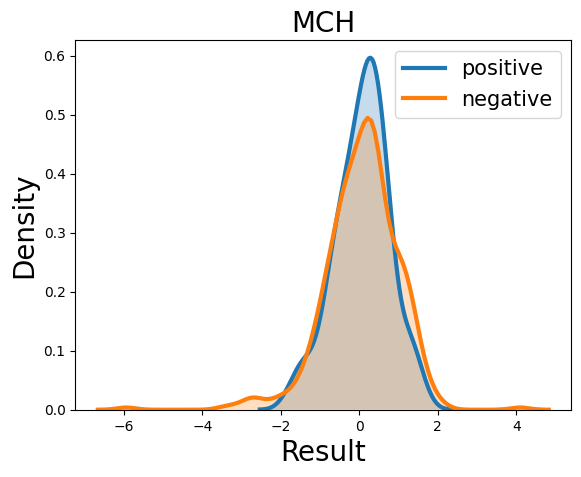
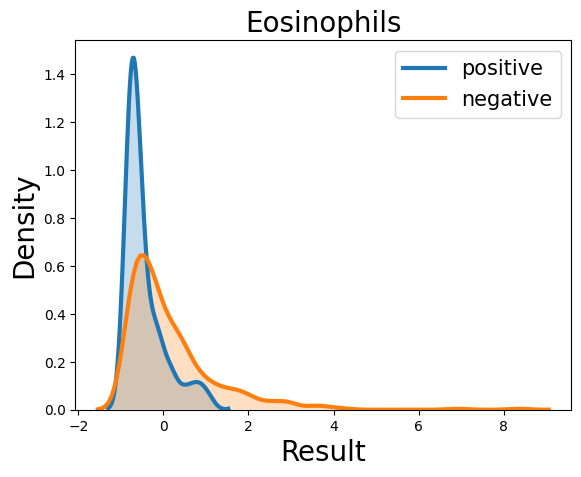
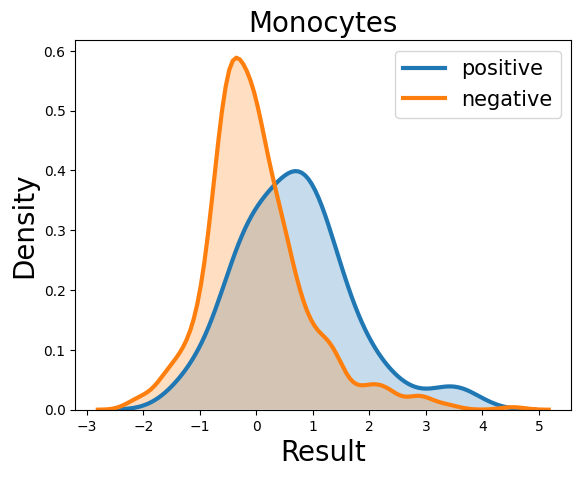
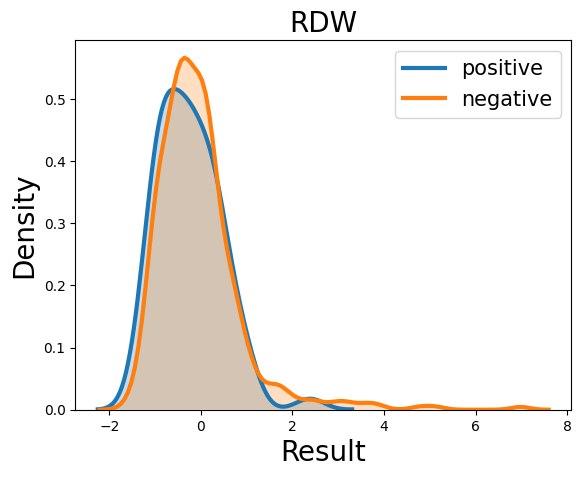
Probability density function (PDF) of all 15 hemogram parameters

References
- Henry, B., de Oliveira, M., Benoit, S., Plebani, M., & Lippi, G. (2020). Hematologic, biochemical and immune biomarker abnormalities associated with severe illness and mortality in coronavirus disease 2019 (COVID-19): a meta-analysis, Clinical Chemistry and Laboratory Medicine (CCLM) (published online ahead of print), 20200369.
- Terpos, E., Ntanasis‐Stathopoulos, I., Elalamy, I., Kastritis, E., Sergentanis, T.N., Politou, M., Psaltopoulou, T., Gerotziafas, G. and Dimopoulos, M.A. (2020), Hematological findings and complications of COVID‐19. Am J Hematol.
- Lippi, G., Plebani, M. (2020). Laboratory abnormalities in patients with COVID-2019 infection, Clinical Chemistry and Laboratory Medicine (CCLM) (published online ahead of print), 20200198.
- Han, H., Yang, L., Liu, R., Liu, F., Wu, K., Li, J., Liu, X., and Zhu, C. (2020). Prominent changes in blood coagulation of patients with SARS-CoV-2 infection, Clinical Chemistry and Laboratory Medicine (CCLM) (published online ahead of print), 20200188.
- Ferrari, D., Motta, A., Strollo, M., Banfi, G., and Locatelli, M. (2020). Routine blood tests as a potential diagnostic tool for COVID-19, Clinical Chemistry and Laboratory Medicine (CCLM) (published online ahead of print), 20200398.
Partners