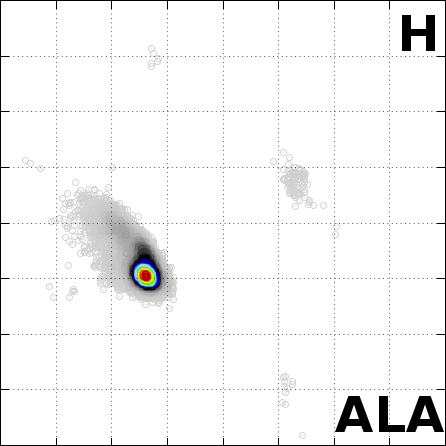
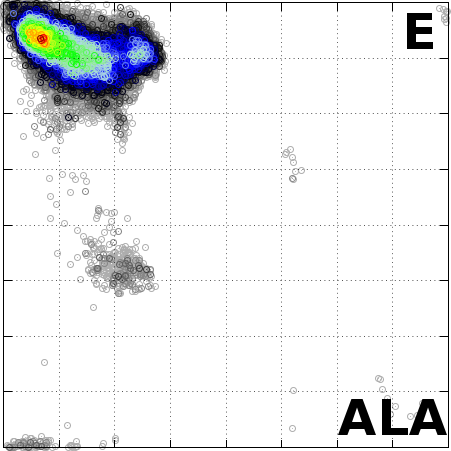
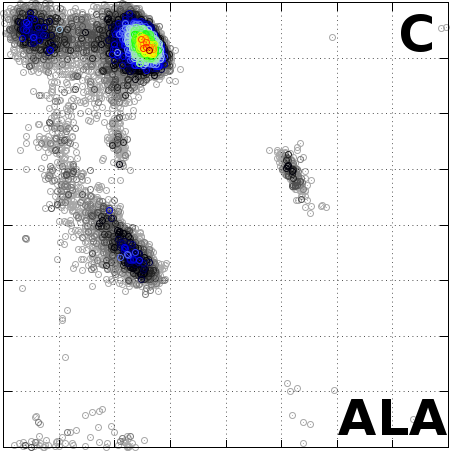
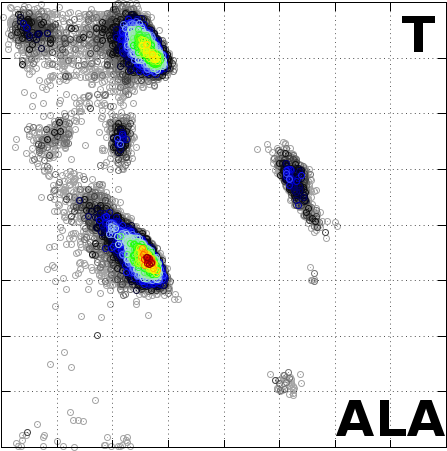
The Angle Probability List (APL) represents the normalized
frequency of observed pairs of amino acid residues and
secondary structure in the Protein Data Bank. We combine
the conformational preferences of amino acid residues
(AA, torsion angles) in proteins with their secondary
structure information (SS).
We selected a set of 6,650 protein structures
from PDB. All 3-D protein structures were experimentally
determined by X-ray diffraction with resolution ≤ 2.0Å
and stored in PDB until December 2014. We remove all
structures with R-factor greater than 0.2. If homologous
protein chains with sequence identity at most 30% were
found, only one of them was retained. We select only
amino acid residues with b-factor ≤ 30Å2 and occupancy
equal to 1. Similar parameters to filter PDB data were
used before by Hovmoller and Ohlson (2002).
For more details please contact us:
mdorn@inf.ufrgs.br
Download
APL Files (15.4 MB)Please cite APL as shown below:
DOI BibTexBORGUESAN, B.; BARBACHAN e SILVA, M.; GRISCI, B. I.; INSTROZA-PONTA, M.; DORN, M. APL: an Angle Probability List to improve knowledge-based metaheuristics for the three-dimensional protein structure prediction. Computational Biology and Chemistry (Print), v. 59, p. 142-157, 2015.
        The 'APL.zip' file contains all APLs arranged by the 20 standard amino
        acid residues (3 letter code) and eight different secondary structure
        assigned by STRIDE.

                    Amino Acid  3-Letter-Code
                     Alanine         Ala
                     Arginine        Arg
                     Asparagine      Asn
                     Aspartic acid   Asp
                     Cysteine        Cys
                     Glutamic acid   Glu
                     Glutamine       Gln               Secondary Structure    1-Letter-Code
                     Glycine         Gly               Alpha helix                 H
                     Histidine       His               3-10 helix                  G
                     Isoleucine      Ile               PI-helix                    I
                     Leucine         Leu               Extended conformation       E
                     Lysine          Lys               Isolated bridge             B or b
                     Methionine      Met               Turn                        T
                     Phenylalanine   Phe               Coil (none of the above)    C
                     Proline         Pro
                     Serine          Ser
                     Threonine       Thr
                     Tryptophan      Trp
                     Tyrosine        Tyr
                     Valine          Val

        Example:
        File ALA_H_histogram.dat represents the APL for the Alanine (ALA) amino acid
        with alpha-Helix (H) secondary structure.

        In each *_histogram.dat file, we have 4 major groups:
        PHI PSI Frequency {OMEGA}

        When the amino acid residue has CHI angles they are represented as:
        PHI PSI Frequency {OMEGA} {CHI}'s

        Example:
        ALA_H_histogram.dat
        PHI        PSI       Freq.    {OMEGA}
        -94.000000 11.000000 0.000010 {0: [169.7]}
        ASN_G_histogram.dat
        PHI        PSI       Freq.    {OMEGA}       {CHI-1}       {CHI-2}
        -99.000000 11.000000 0.000240 {0: [-176.0]} {0: [-171.3]} {0: [48.1]}

        When the number of occurrences grows, the number of {OMEGA} and {CHI}'s grows as well.
        Example:
        ALA_H_histogram.dat
        PHI        PSI       Freq.    {OMEGA}
        -95.000000 20.000000 0.000019 {0: [172.6, 173.5]}
        ASN_G_histogram.dat
        PHI        PSI        Freq.    {OMEGA}               {CHI-1}             {CHI-2}
        -95.000000 -16.000000 0.000480 {0: [-175.5, -159.3]} {0: [-68.3, -66.1]} {0: [-51.5, -33.8]}

        When the number of occurrences grows but the values of {OMEGA} or {CHI}'s
        are different, sub-groups are made.
        Example:
        ALA_H_histogram.dat
        PHI        PSI       Freq.    {OMEGA}
        -95.000000 -5.000000 0.000019 {0: [-179.1], 1: [172.0]}
        ASN_G_histogram.dat
        PHI        PSI        Freq.    {OMEGA}               {CHI-1}             {CHI-2}
        -95.000000 -11.000000 0.000480 {0: [-176.6, -163.6]} {0: [-79.8, -74.1]} {0: [-23.1], 1: [131.0]}

        PHI        PSI      Freq.    {OMEGA}                   {CHI-1}             {CHI-2}
        -91.000000 8.000000 0.000480 {0: [-179.2], 1: [173.4]} {0: [-76.7, -75.1]} {0: [-13.8, -9.4]}

        PHI        PSI        Freq.    {OMEGA}                   {CHI-1}                   {CHI-2}
        -71.000000 -24.000000 0.000480 {0: [-176.1], 1: [175.3]} {0: [-170.2], 1: [-68.8]} {0: [-36.1], 1: [51.2]}